圖表 (Chart) 常運用於試算表如Microsoft Excel, Mac Numbers, Apache OpenOffice Calc等辦公室軟體,透過圖表讓資料以更簡單明瞭的方式呈現。此外,圖表亦常與商業智慧 (Business Intelligence) 搭配,透過商業智慧軟體與資料庫或資料倉儲整合,提供向下分析與互動功能的動態圖表,根據指標在特定期間的變化,以動態的方式呈現資訊,使圖表產生更多樣化的呈現,常見的商業智慧軟體有SAP BusinessObjects, SAS Business Intelligence, Oracle Business Intelligence, IBM Cognos, Microsoft ProClarity, MicroStrategy等。
折線圖 (Line Chart) 區域折線圖 (Interval Line Chart) 圓形圖 (Pie Chart) 分裂式圓形圖 (Slice Pie Chart) 長條圖 (Bar Chart) 水平長條圖 (Horizontal Bar Chart) 堆疊長條圖 (Stack Bar Chart) 區域圖 (Area Chart) 組合圖 (Combination Chart) OHLC圖 (Open-High-Low-Close Chart) 燭台圖 (Candlestick Chart) 泡泡圖 (Bubble Chart) 儀錶圖 (Meter Gauge)
jqPlot可自http://www.jqplot.com 下載,將zip解壓縮至jQuery Mobile的相關目錄,為能執行jqPlot,除了原有jQuery Mobile的css與js檔案之外,另需在<head></head>網頁標籤部份匯入以下檔案:
jquery.jqplot.min.css jquery.jqplot.min.js jqplot.mobile.min.js
並依圖表格式與功能,需匯入以下檔案:
設定文字:jqplot.canvasTextRenderer.min.js 設定圖例:jqplot.canvasAxisLabelRenderer.min.js 設定座標軸:jqplot.dateAxisRenderer.min.js 設定座標軸刻度:jqplot.canvasAxisTickRenderer.min.js 處理遊標事件:jqplot.cursor.min.js
透過以上檔案則可產生折線圖,其餘圖表依不同的圖表類型,需額外匯入以下檔案:
圓形圖:jqplot.pieRenderer.min.js 長條圖:jqplot.barRenderer.min.js, jqplot.categoryAxisRenderer.min.js OHLC圖:jqplot.ohlcRenderer.min.js 蠟燭圖:jqplot.ohlcRenderer.min.js 泡泡圖:jqplot.bubbleRenderer.min.js 儀錶圖:jqplot.meterGaugeRenderer.min.js
折線圖 (Line Chart) 折線圖 (Line Chart) 用以顯示一段時間內的連續資料,且依據一定的比例進行設定,因此適合顯示相等間隔內資料的趨勢,在折線圖中,類別資料沿著水平座標軸均勻分散,所有資料沿著垂直座標軸均勻分散。
為能執行折線圖,除了原有jQuery Mobile的css與js檔案之外,另需在<head></head>網頁標籤部份匯入以下檔案:
其程式部份如下,其中設定頁面ID為linechart、圖表ID為chart (可自行命名),以做為繪製圖表的依據:
至於圖表內容,jqPlot是以額外的JavaScript設定,可定義於同一HTML網頁中或其他的JavaScript檔案,若為後者,則需在<head></head>網頁標籤部份匯入,例如一名為linechart.js檔案,則如下匯入JavaScript檔案:
為設定圖表內容,在linechart.js檔案中分別定義以下內容:
var data = [
  [[2000, 2.00],[2001,10.00],[2002,13.00],[2003,18.00],
   [2004,28.00],[2005,17.00],[2006,23.00],[2007,25.00],
   [2008,35.00],[2009,22.00],[2010,28.00]
  ], // Series 1
  [[2000, 7.00],[2001,18.00],[2002,20.00],[2003,29.00],
   [2004,20.00],[2005,11.00],[2006,18.00],[2007,29.00],
   [2008,33.00],[2009,27.00],[2010,25.00]
  ]  // Series 2
];

$.jqplot.config.enablePlugins = true;

var options = {

  title: 'Sales Trend',

  series: [
    {
      label:'Market',
      color:'#0000FF',
      showMarker:true
    },
    {
      label:'Sales',
      color:'#FF0000',
      showMarker:true,
    },
  ],

  legend: {
    show:true,
    showSwatches:true,
    textColor:'#FFFFFF',
    fontSize:12,
    location:'se'
  },

  axes: {
    xaxis: {
      label:'Year',
      labelRenderer:$.jqplot.CanvasAxisLabelRenderer,
      tickRenderer: $.jqplot.CanvasAxisTickRenderer,
      tickOptions:{angle:-90}
    },
    yaxis: {
      label:'US$',
      min:0,
      max:40,
      labelRenderer:$.jqplot.CanvasAxisLabelRenderer,
      tickRenderer: $.jqplot.CanvasAxisTickRenderer,
    }
  },
  cursor:{zoom:true}
};

$(document).on("pageshow", "#linechart", function(e){
  plot = $.jqplot("chart", data, options);
});

$(window).on("orientationchange", function(e){
  plot.replot();
});

$(document).on("pagehide", "#linechart", function(e){
  plot.destroy();
});
以下程式分別設定當顯示頁面時則繪製圖表 (pageshow)、當手機或平版電腦改變方向時 (orientationchange)、當隱藏或關閉頁面時 (pagehide),其中linechart與chart分別為前述之頁面ID與圖表ID,以做為繪製圖表的依據:
$(document).on("pageshow", "#linechart", function(e){
  plot = $.jqplot("chart", data, options);
});

$(window).on("orientationchange", function(e){
  plot.replot();
});

$(document).on("pagehide", "#linechart", function(e){
  plot.destroy();
});
圖表數例以下列方式設定:
var data = [
  [[2000, 2.00],[2001,10.00],[2002,13.00],[2003,18.00],
   [2004,28.00],[2005,17.00],[2006,23.00],[2007,25.00],
   [2008,35.00],[2009,22.00],[2010,28.00]
  ], // Series 1
  [[2000, 7.00],[2001,18.00],[2002,20.00],[2003,29.00],
   [2004,20.00],[2005,11.00],[2006,18.00],[2007,29.00],
   [2008,33.00],[2009,27.00],[2010,25.00]
  ]  // Series 2
];
此外圖表的選項與格式,分別設定如下,例如圖表標題 (Title):
title: 'Sales Trend',
設定各資料序列 (Series) 的標籤 (label)、線條顏色 (color)、是否顯示線條標記 (showMarker):
series: [
  {
    label:'Market',
    color:'#0000FF',
    showMarker:true
  },
  {
    label:'Sales',
    color:'#FF0000',
    showMarker:true
  },
],
設定圖例 (Legend) 的文字顏色 (textColor)、字型大小 (fontSize)、置放位置 (location)、是否顯示圖例 (show)、是否顯示色板 (showSwatches):
legend: {
  show:true,
  showSwatches:true,
  textColor:'#FFFFFF',
  fontSize:12,
  location:'se'
},
設定座標軸 (Axis) 的標籤 (label)、刻度標籤的旋轉角度 (angle)、刻度的最小值 (min)、刻度的最大值 (max):
axes: {
  xaxis: {
    label:'Year',
    labelRenderer:$.jqplot.CanvasAxisLabelRenderer,
    tickRenderer: $.jqplot.CanvasAxisTickRenderer,
    tickOptions:{angle:-90}
  },
  yaxis: {
    label:'US$',
    min:0,
    max:40,
    labelRenderer:$.jqplot.CanvasAxisLabelRenderer,
    tickRenderer: $.jqplot.CanvasAxisTickRenderer,
  }
},
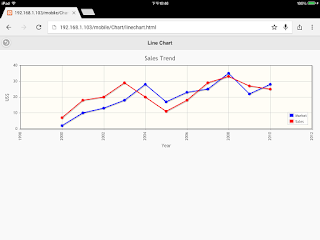
【執行結果】
以下為以Android智慧型手機瀏覽器執行的結果,由於智慧型手機直立時,畫面較窄,因此圖表會自動調整長寬比例:
以下為以Apple iPad平版電腦瀏覽器執行的結果,由於平版電腦橫向時,畫面較寬,因此可得到較佳的效果:
【參考資料】
https://www.apachefriends.org http://jquerymobile.com http://jquery.com http://www.jqplot.com


 JavaFX 8技術手冊.
 JavaFX遊戲程式設計.
 Visual C++ Web程式設計.
 深入研究JavaFX 2.
 深入研究Java Swing.
 完全探索網路程式設計 - 使用Java.
